
Umami, is an open-source analytics platform that’s shaking things up as a lightweight, privacy-focused alternative to Google Analytics. It’s free, self-hosted, and packed with features that make tracking and analyzing your website data feel like a breeze.
Whether you’re running a blog, an e-commerce store, or a portfolio site, Umami helps you gain insights into your visitors’ behavior with minimal fuss. In this deep dive, we’ll explore what makes Umami special, walk through setting it up, and show you how to unlock its full potential to grow your online presence—all in a relaxed, straightforward way.
Why Umami?
Google Analytics, while powerful, often bombards you with complex menus and metrics that require a PhD to decipher. Umami takes a different approach. It’s designed to give you clear, actionable insights without the bloat.
Here’s why it stands out:
- Open-Source and Free: Umami’s code is publicly available, meaning you can host it yourself at no cost.
- No subscriptions, no hidden fees—just pure analytics goodness.
- Privacy-First: Unlike some platforms that treat user data like a gold mine, Umami respects privacy. It’s GDPR-compliant, doesn’t use cookies by default, and lets you control what data you collect.
- Lightweight and Fast: Umami won’t slow down your website. Its tracking script is tiny, and the dashboard loads in a snap.
- User-Friendly Interface: The clean, intuitive design makes it easy for beginners and pros alike to navigate.
- Self-Hosted Flexibility: Host it on your own server or a cloud provider, giving you full control over your data.
Whether you’re a small business owner, a developer, or a marketer, Umami’s simplicity and power make it a go-to choice for understanding your audience. So, let’s roll up our sleeves and see how to get it up and running.
Getting Started with Umami: Installation Made Easy

Setting up Umami is straightforward, whether you’re a tech wizard or a newbie. You can deploy it on your own server, use a cloud provider, or leverage a platform to handle the heavy lifting. For this guide, we’ll walk through a manual self-hosted setup and touch on easier alternatives later. Don’t worry—we’ll keep it simple and avoid geek-speak overload.
Step 1: Prerequisites
Before diving in, you’ll need a few things:
- A server or cloud instance (e.g., DigitalOcean, AWS, or a local machine).
- Node.js (version 14 or higher) and npm installed.
- A PostgreSQL or MySQL database to store your data.
- A domain or IP address to access your Umami instance.
- Basic command-line skills (don’t panic—we’ll guide you!).
If this sounds daunting, platforms like Vercel or Render can simplify deployment with one-click options. For now, let’s assume you’re going the self-hosted route for full control.
Step 2: Downloading Umami
Umami’s code lives on GitHub, so head over to the official repository. You can clone it to your server using this command:
git clone https://github.com/umami-software/umami.gitThis creates a folder called umami with all the necessary files. Navigate into it:
cd umamiStep 3: Setting Up the Database
Umami needs a database to store your analytics data. Let’s set up PostgreSQL as an example (MySQL works similarly). If you don’t have PostgreSQL installed, grab it with:
sudo apt update
sudo apt install postgresql postgresql-contrib
Create a new database and user:
sudo -u postgres psql
CREATE DATABASE umami;
CREATE USER umami_user WITH PASSWORD 'your_secure_password';
GRANT ALL PRIVILEGES ON DATABASE umami TO umami_user;
\q
Replace 'your_secure_password' with something strong—don’t skimp on security!
Step 4: Configuring Umami
Umami uses environment variables to connect to your database and configure settings. In the umami folder, create a .env file:
nano .envAdd the following, adjusting values as needed:
DATABASE_URL=postgresql://umami_user:your_secure_password@localhost:5432/umami
APP_SECRET=your_random_string
The APP_SECRET is a unique key for securing your instance—generate a random string (at least 32 characters) using a tool like openssl:
openssl rand -base64 32Save and exit (Ctrl+O, Enter, Ctrl+X).
Step 5: Installing Dependencies and Building
With the database ready, install Umami’s dependencies:
npm installThen, build the application:
npm run buildThis prepares Umami for launch. If you hit errors (e.g., missing Node.js versions), double-check your setup or consult Umami’s documentation.
Step 6: Running Umami
Start Umami with:
npm startIf all goes well, Umami will be running on http://localhost:3000. Open your browser, navigate to your server’s IP or domain (e.g., http://your-server-ip:3000), and you’ll see the login screen. The default credentials are:
- Username: admin
- Password: umami
Log in, and boom—you’re in! For security, change the password immediately under Settings > Profile.
Step 7: Optional—Setting Up a Reverse Proxy
To make Umami accessible via a domain (e.g., analytics.yourwebsite.com) and secure it with HTTPS, set up a reverse proxy using Nginx or Caddy. Here’s a quick Nginx example:
Install Nginx:
sudo apt install nginxCreate a config file:
sudo nano /etc/nginx/sites-available/umamiAdd:
server {
    listen 80;
    server_name analytics.yourwebsite.com;

    location / {
        proxy_pass http://localhost:3000;
        proxy_set_header Host $host;
        proxy_set_header X-Real-IP $remote_addr;
        proxy_set_header X-Forwarded-For $proxy_add_x_forwarded_for;
    }
}
Enable it:
sudo ln -s /etc/nginx/sites-available/umami /etc/nginx/sites-enabled/
sudo nginx -t
sudo systemctl reload nginx
For HTTPS, use Let’s Encrypt with Certbot:
sudo apt install certbot python3-certbot-nginx
sudo certbot --nginx -d analytics.yourwebsite.com
Now your Umami instance is live, secure, and ready to track!
Adding Your First Website
With Umami running, it’s time to track your website. The dashboard starts empty, but adding a site is quick. Here’s how:
- Go to Settings: Click the gear icon in the top-right corner.
- Add a Website: Hit “Add Website.”
- Enter Details:
- Name: Something descriptive (e.g., “My Blog”).
- Domain: Your website’s URL (e.g., www.mywebsite.com). Exclude http:// or https://.
- Save: Click the save button.
Umami generates a tracking code for your site. To access it:
- Go to your website’s settings in Umami.
- Click “Edit” next to your website.
- Copy the tracking code (it’s a small JavaScript snippet).
Now, add this code to your website. If you’re using a CMS like WordPress:
- Install a plugin like Insert Headers and Footers.
- Paste the tracking code in the <head> section.
- Save changes.
For custom sites, open your code editor and paste the script before the closing </head> tag in your HTML. For example:
<head>
  <title>My Website</title>
  <script async defer src="https://analytics.yourwebsite.com/umami.js" data-website-id="your-unique-id"></script>
</head>
Refresh your website, visit a few pages, and head back to Umami. Click the “View” button next to your website, and you’ll see data trickling in—page views, visitors, and more. It’s alive!
Exploring the Umami Dashboard
Umami’s dashboard is where the magic happens. It’s clean, intuitive, and packed with insights. Let’s break down the key sections and what they tell you.
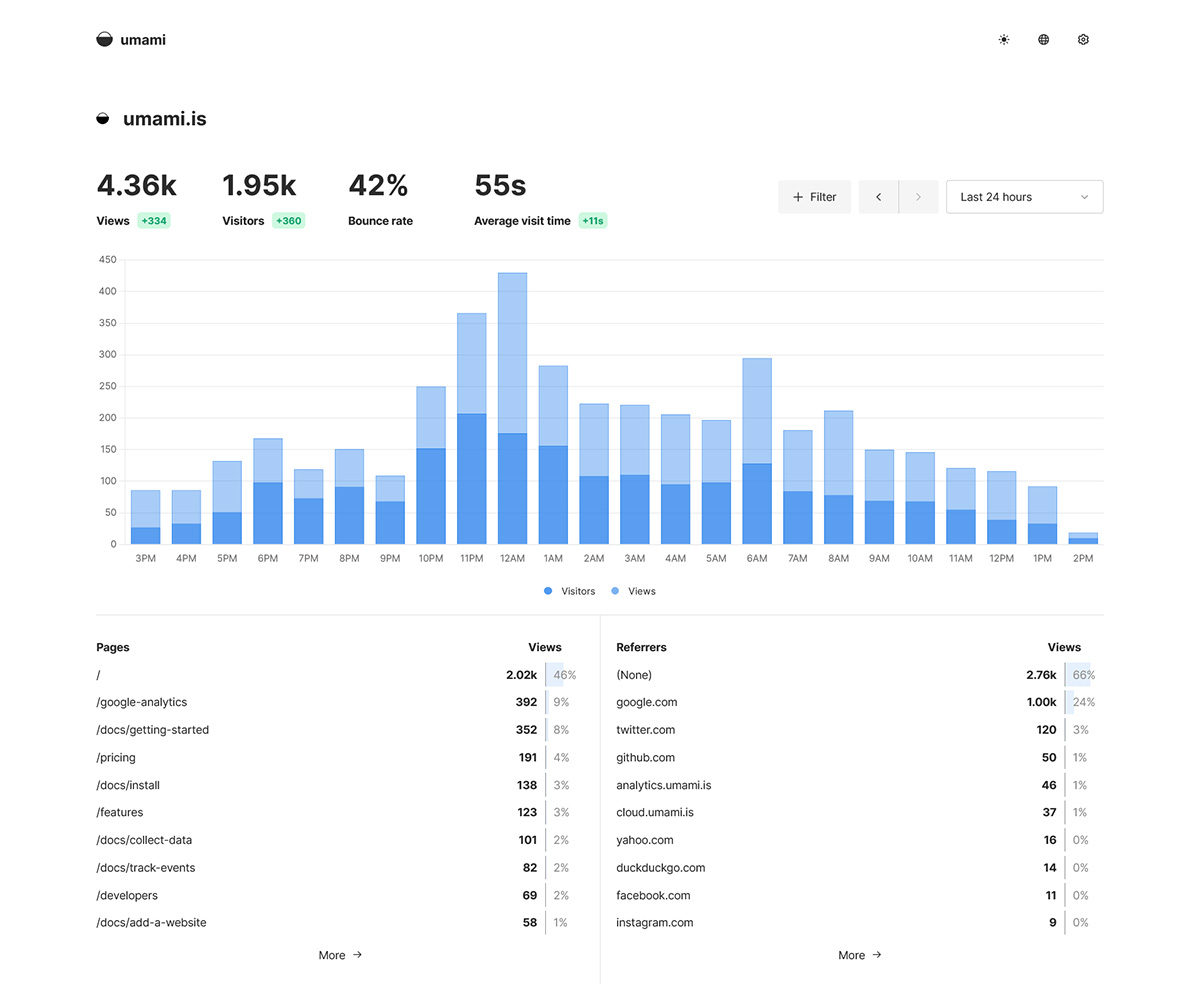
Overview Tab
The Overview tab is your go-to for a snapshot of your website’s performance. You’ll see:
- Page Views: Total views across all pages.
- Unique Visitors: Number of distinct users.
- Sessions: Groups of interactions by a single user.
- Bounce Rate: Percentage of visitors who leave after viewing one page.
- Average Session Duration: How long users stick around.
A graph shows trends over time, with filters for:
- Today: Real-time data.
- Last 24 Hours: Recent activity.
- This Week/Month: Broader trends.
- Custom Range: Pick specific dates.
For example, if you notice a spike in page views at 8 AM, you might check which pages were hit most. Clicking into the Pages section reveals URLs like /index.html or /about, helping you spot popular content.
Events Tab
Want to know what users are doing on your site? The Events tab tracks specific actions, like button clicks or form submissions. By default, Umami logs page views, but you can add custom events. For instance, let’s track clicks on an “Add to Cart” button.
In your website’s HTML, add a data attribute to the button:
<button data-umami-event="add-to-cart">Add to Cart</button>No extra JavaScript needed! If you want to include details (e.g., product ID), use:
<button data-umami-event="add-to-cart" data-umami-event-product-id="123">Add to Cart</button>Alternatively, use JavaScript for dynamic events:
umami.track('add-to-cart', { productId: '123' });After clicking the button a few times, check the Events tab. You’ll see “add-to-cart” listed with a count of triggers. This is gold for e-commerce sites or tracking user engagement.
Users Tab
The Users tab shows anonymous profiles of your visitors, identified by unique IDs. For each user, Umami logs:
- Country: Based on IP (privacy-respecting, no precise location).
- Device: Mobile, desktop, or tablet.
- Operating System: Windows, macOS, iOS, etc.
- Browser: Chrome, Firefox, Safari, etc.
If you run a membership site and want to tie events to specific users, use the umami.identify function:
umami.identify({ userId: 'user123', email: 'user@example.com' });This links actions to a user profile, perfect for SaaS platforms or forums. For public sites like blogs, the default anonymous tracking works fine.
Real-Time Tab
The Real-Time tab is like a live feed of your website’s activity. It updates instantly, showing:
- Current Visitors: Who’s on your site right now.
- Live Events: Page views, clicks, or custom events as they happen.
- Geographic Data: A world map highlighting visitor locations.
- Referrers: Where traffic is coming from (e.g., Google, Twitter).
This is great for monitoring campaigns or spotting sudden traffic spikes. For example, if a tweet goes viral, you’ll see referrers from t.co lighting up.
Compare Tab
The Compare tab lets you analyze two time periods side by side. Want to see how this week’s traffic stacks up against last week? Select “This Week” and “Previous Period.” You can filter by:
- URL: Compare specific pages.
- Referrer: See if Google Ads outperformed LinkedIn.
- Event: Track changes in button clicks or sign-ups.
This helps you measure the impact of changes, like a new landing page or ad campaign.
Reports Tab
Reports are Umami’s secret weapon for digging deeper. You can create custom reports to track metrics like:
- Insights: General trends in traffic or events.
- Funnels: How users move through steps (e.g., homepage → product → checkout).
- Retention: Are users returning day after day?
- UTM: Track campaign performance via UTM parameters.
- Goals: Monitor progress toward targets (e.g., 10 sign-ups daily).
- Journey: Map user paths across your site.
- Revenue: Estimate earnings (if you integrate e-commerce data).
Let’s create a retention report:
- Click “New Report” > “Retention.”
- Name it “User Retention.”
- Select your website and a date range.
- Run the query.
The result shows how many users return over time. For a new site, it might show one visitor (you!), but for established sites, it reveals stickiness—crucial for subscriptions or communities.
Now, try a goal report:
- Click “New Report” > “Goals.”
- Name it “Daily Add to Cart.”
- Set the event to add-to-cart and goal to 10 per day.
- Run and save.
You’ll see progress (e.g., 2/10 add-to-carts today). Reports don’t yet integrate into the main dashboard, but checking them manually still offers powerful insights.
Advanced Features
Umami’s core is simple, but it has advanced tricks for power users. Let’s explore a few.
Teams and Permissions
Running a business with multiple stakeholders? Umami’s Teams feature lets you control access. Here’s how:
- Go to Settings > Teams.
- Create a team (e.g., “Marketing Crew”).
- Add members via email or username.
- Assign websites they can view or edit.
For example, give your SEO specialist access to traffic data but lock developers out of sensitive reports. This keeps things organized and secure.
Custom Filters
Filters supercharge your analysis. In any tab, click the filter icon to narrow down data by:
- URL: Focus on a single page.
- Referrer: Isolate traffic from a source.
- Event: Track specific actions.
- Country/Device/Browser: Segment your audience.
Say you’re running a Facebook ad. Filter by facebook.com as the referrer to see how it’s performing. Combine filters (e.g., facebook.com + /product-page) for laser-focused insights.
API Access
Developers, rejoice—Umami has a REST API for pulling data programmatically. Access it at your-umami-url/api. Common uses:
- Build custom dashboards.
- Integrate with Slack for real-time alerts.
- Export data to spreadsheets.
To use the API, authenticate with your credentials and query endpoints like /api/websites or /api/stats. Check the API docs for details.
Dark Mode and Languages
For comfort, Umami supports dark mode (toggle it in the top-right corner) and multiple languages, including English, Spanish, and French. Pick your vibe and analyze in style.
Umami vs. Google Analytics

You might be wondering, “Why ditch Google Analytics for Umami?” Here’s a head-to-head comparison:
- Ease of Use: Google Analytics’ interface can feel like a maze; Umami’s is clean and intuitive.
- Privacy: Google tracks users extensively; Umami prioritizes minimal data collection.
- Cost: Google Analytics is free for basic use, but premium plans are pricey. Umami’s self-hosted version is free forever.
- Customization: Umami’s open-source nature lets you tweak the code; Google Analytics is a closed system.
- Performance: Umami’s lightweight script won’t bog down your site; Google’s can be heavier.
That said, Google Analytics shines for massive datasets or advanced integrations (e.g., Google Ads). If you’re a small to medium-sized business, blogger, or privacy advocate, Umami’s simplicity and control are hard to beat.
Tips for Maximizing Umami
To get the most out of Umami, try these:
- Track Key Events: Beyond page views, monitor actions like downloads, sign-ups, or video plays.
- Set Goals: Use reports to measure progress toward business objectives.
- Check Real-Time During Campaigns: Launch a sale? Watch live data to gauge impact.
- Backup Your Database: Since you’re self-hosting, schedule regular backups to avoid data loss.
- Explore the Docs: Umami’s documentation is a treasure trove of tips and tutorials.
Troubleshooting Common Issues
Running into hiccups? Here are quick fixes:
- No Data Showing: Ensure the tracking code is correctly placed and your website’s domain matches Umami’s settings.
- Database Errors: Double-check your .env file’s DATABASE_URL and confirm your database is running.
- Slow Dashboard: If self-hosting on a low-spec server, upgrade your plan or optimize your database.
- Login Issues: Reset the admin password via the database (see docs for steps).
For persistent problems, Umami’s GitHub issues page or community forums are great places to seek help.
Wrapping Up
At its core, analytics isn’t just about numbers—it’s about understanding your audience. Umami empowers you to answer questions like:
- Which pages keep visitors hooked?
- Where is my traffic coming from?
- Are users taking the actions I want (e.g., buying, signing up)?
- How can I improve my site’s performance?
By self-hosting Umami, you’re not just saving money—you’re taking ownership of your data in a world where privacy is increasingly rare. Plus, its open-source ethos means you’re part of a community building tools for everyone, not just big corporations.
Umami is more than an analytics tool—it’s a mindset. It proves you don’t need complex systems or deep pockets to gain deep insights into your website’s performance. With its easy setup, privacy focus, and powerful features, Umami is a game-changer for anyone looking to grow their online presence.
From tracking page views to monitoring custom events, creating reports, and comparing trends, Umami puts you in the driver’s seat. Whether you’re a solo blogger or a growing startup, it’s a tool that scales with you. So, fire up that server, paste that tracking code, and start exploring what your visitors are telling you. The data’s there—Umami just makes it fun to discover.


0 comments:
Post a Comment