
Imagine you’re a cybersecurity enthusiast, sipping coffee at your desk, ready to beef up your open-source Security Information and Event Management (SIEM) setup. You’ve heard about Sigma rules—those powerful, community-driven detection patterns that can spot threats across platforms. But integrating them into tools like Wazuh or Graylog? That’s where things get tricky. Enter Velociraptor, an open-source digital forensics and incident response tool that’s here to save the day with its slick Sigma rule integration. In this article, we’re diving deep into how to set up Sigma analysis in Velociraptor, automate scans, and pipe those juicy detections straight into Copilot for incident management. Buckle up—it’s going to be a hands-on, techy ride with a casual vibe, just like flipping through your favorite computer tutorial mag.
Why Sigma Rules Matter
Before we jump into the nitty-gritty, let’s talk about why Sigma rules are a big deal. Sigma is like the universal translator of threat detection. It’s an open-source standard for writing detection rules that work across different SIEMs and log formats. Think of it as a recipe book for spotting bad actors—whether it’s a sneaky PowerShell script or a suspicious process accessing your system. The catch? Translating Sigma rules into the native language of tools like Wazuh can be a headache. Wazuh’s rule syntax is flexible, but Sigma’s complexity often leads to a less-than-perfect match. Some folks have tried Python scripts to bridge the gap (check GitHub for repos), but the results? Meh, not robust enough.
That’s where Velociraptor shines. Instead of forcing a clunky translation, it runs Sigma detections natively on endpoints. Only the hits—events that match a Sigma rule—get sent to your SIEM stack. This keeps your log volume lean and your alerts meaningful. Plus, Velociraptor’s team has done the heavy lifting, integrating rules from projects like Hayabusa and Sigma HQ. Ready to see it in action? Let’s get started.
Setting Up Sigma in Velociraptor

First things first: you’ll need a working Velociraptor server. If you’re new to Velociraptor, it’s a lightweight, agent-based tool that runs queries directly on endpoints—Windows, Linux, macOS, you name it. For this tutorial, we’ll assume you’ve got Velociraptor installed (version 0.7.0 or later should do the trick). If not, head to their official docs for a quick setup guide.
Step 1: Importing Sigma Rules
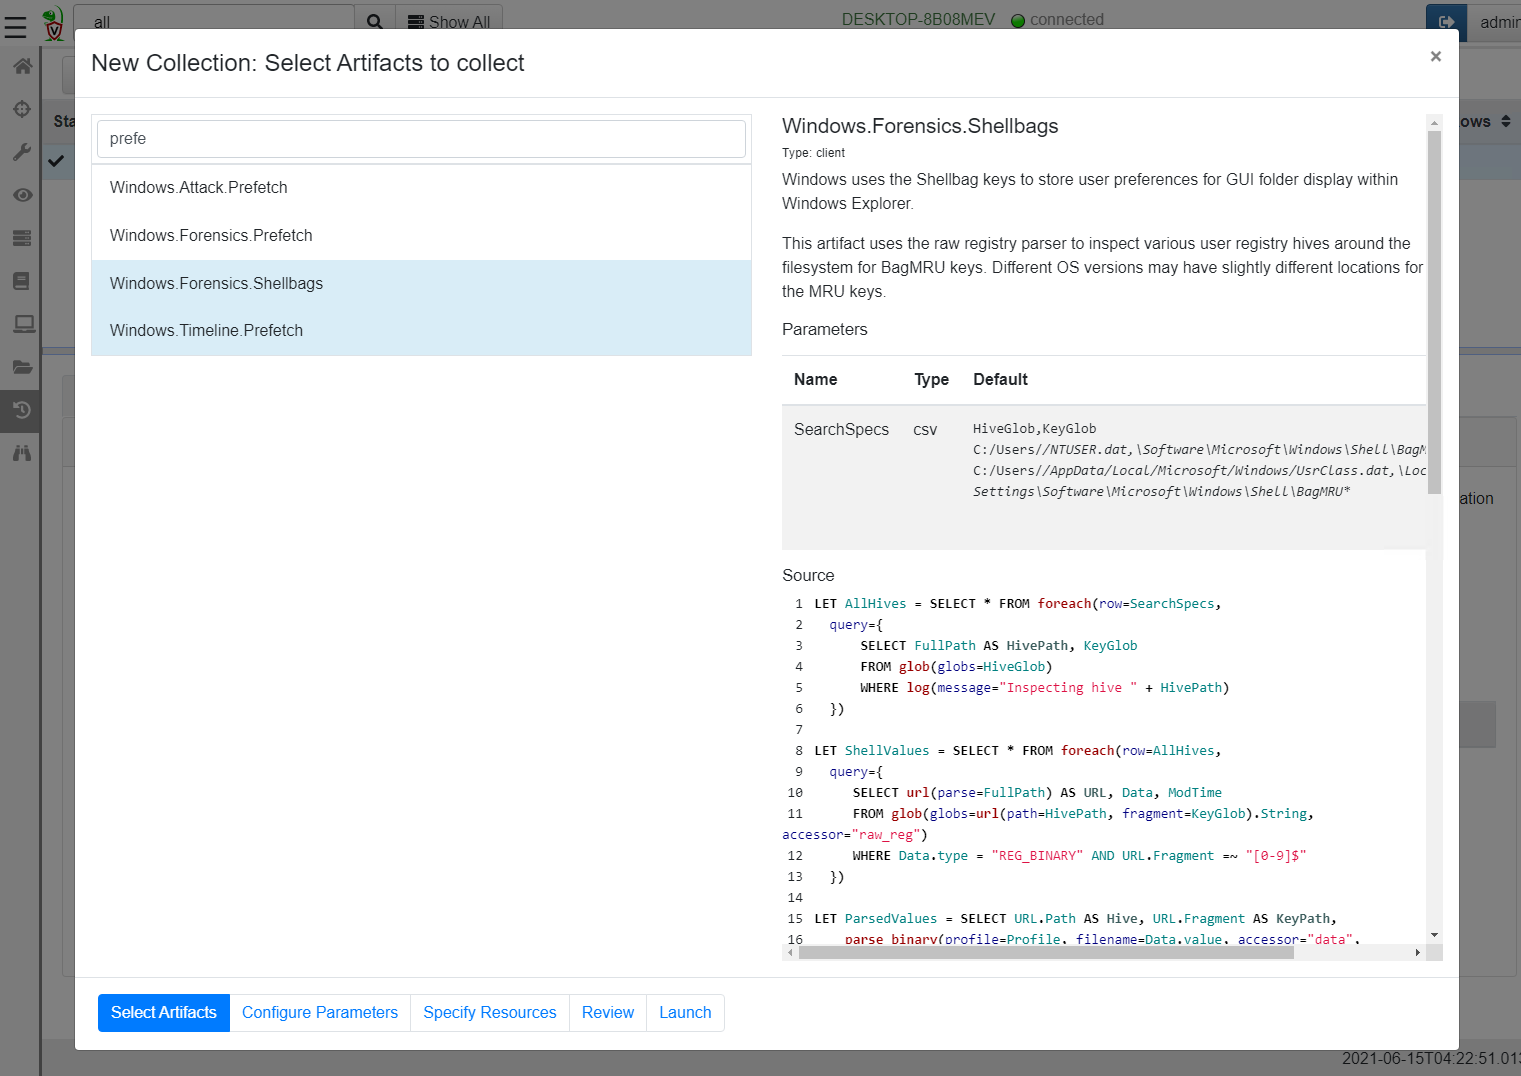
Velociraptor makes importing Sigma rules a breeze with its artifact packs—prepackaged configs that bundle everything you need. Here’s how to get them into your server:
-
Download the Artifact Pack: Head to Velociraptor’s Sigma webpage (linked in their docs) and grab the artifact pack ZIP file. This pack includes YAML definitions for Sigma rules, sourced from Hayabusa and Sigma HQ. If you’re running the latest Velociraptor release, these might already be baked in, but let’s cover the manual process just in case.
-
Upload to Velociraptor: Log into your Velociraptor server’s GUI. Navigate to the Artifacts section and select View Artifacts. Click Upload Artifact Pack, choose the ZIP file you downloaded, and hit Upload. This unpacks the Sigma-related artifacts into your server.
-
Import Curated Rules: Now, let’s pull in the actual Sigma rules. Go to Server Artifacts and select New Collection. Search for Server.Import.CuratedSigma and click it. In the Configure Parameters panel, you’ll see options to import rule sets like:
- Hayabusa Rules: General-purpose Sigma rules for Windows event logs.
- Hayabusa Live Detection: Rules tailored for real-time monitoring.
- ChopChopGo (Linux): Linux-specific rules (we’ll skip these for now, but they’re handy for mixed environments).
For this demo, select Hayabusa Rules and Hayabusa Live Detection. Click Launch to fetch and compile the rules. Velociraptor will download the latest rule sets and store them on your server. You’ll see a progress log showing the import status.
Step 2: Running a Standalone Sigma Scan
With the rules imported, let’s test them on a Windows endpoint. This is where Velociraptor’s endpoint querying flexes its muscles.
- Select an Endpoint: In the Velociraptor GUI, go to the Clients tab and pick a Windows machine running the Velociraptor agent.
- Create a New Collection: Click Collected > New Collection. Search for Windows.Hayabusa.Rules and select it. This artifact tells Velociraptor to scan the endpoint’s Windows event logs (e.g., Application, Security, Sysmon, PowerShell) for Sigma rule matches.
- Configure Parameters:
- Event Log Directory: By default, Velociraptor points to C:\Windows\System32\winevt\Logs\. This is where Windows stores logs like Security and Sysmon. Unless you’ve customized your setup, leave this as is.
- Rule Levels: Sigma rules are tagged with severity levels (Informational, Low, Medium, High, Critical). For testing, select All to catch everything.
- Rule Status: Choose Stable and Experimental to include both vetted and cutting-edge rules.
- Exclusions: You can exclude specific rules by regex (we’ll cover this later).
- Date Range: Leave this blank to scan all available logs.
- Launch the Scan: Hit Launch. Velociraptor will query the endpoint, run the Sigma rules against its event logs, and return matches. Check the Results tab to see what popped up. You might see hits like “Suspicious Process Creation” or “PowerShell Script Execution”—each with a rule title, severity, and event details.
To make things interesting, let’s simulate an attack. Grab a PowerShell attack simulator from GitHub (like Atomic Red Team’s scripts). On your test endpoint, open PowerShell and run a command like:
Invoke-AtomicTest T1059.001 -TestName "PowerShell Malicious Script"Note: Disable Windows Defender’s real-time protection temporarily to avoid blocks (but turn it back on after testing!). Rerun the Sigma scan, this time filtering for High and Critical rule levels to focus on serious threats. Check the results—you should see new matches tied to the simulated attack, like “Malicious PowerShell Command Execution.”
Step 3: Excluding Noisy Rules
Noticed some false positives? Maybe Velociraptor flagged a legit process (like Wazuh’s agent) as suspicious. Sigma’s flexibility lets you exclude rules that don’t fit your environment. Here’s how:
-
Identify the Noisy Rule: In your scan results, note the rule title or ID of the false positive (e.g., “Process Access by Wazuh Agent”).
-
Add an Exclusion: Start a new Windows.Hayabusa.Rules collection. In the Rule Exclusions field, enter a regex pattern to match the rule title. For example:
Process\sAccess.*Wazuh -
Rerun the Scan: Launch the collection. The excluded rule won’t trigger alerts anymore, keeping your results clean.
Automating Sigma Analysis
Manually running scans is fine for testing, but in a real environment, you want Sigma rules checking your endpoints 24/7. Velociraptor’s client monitoring feature makes this a snap.
Step 1: Configure Client Monitoring
- Access Client Events: In the Velociraptor GUI, go to Client Events and click Update Client Monitoring Table.
- Select Endpoints: Choose which agents to monitor. Use labels (e.g., “Windows_Servers”) if you’ve tagged your agents, or select All for broad coverage.
- Add the Monitoring Artifact: Click Select Artifacts and search for Windows.Hayabusa.Monitoring. This artifact automates the Sigma scans we ran manually.
- Configure Parameters:
- Rule Levels: Set to High and Critical to prioritize serious threats.
- Rule Status: Stick with Stable and Experimental.
- Exclusions: Paste any regex exclusions from earlier (e.g., for Wazuh’s agent).
- Frequency: This controls how often Velociraptor scans. The default is 60 seconds, but you can tweak it. Lower values (e.g., 5 seconds) mean near-real-time detection but higher CPU usage. During testing, 60 seconds strikes a good balance.
- Launch Monitoring: Click Launch. Velociraptor will now scan your endpoints at the set interval, checking event logs for Sigma rule matches.
Step 2: Verify Monitoring
Refresh the Client Events page. You should see Windows.Hayabusa.Monitoring listed. Click it to view logs. These show which rules loaded (e.g., “236 Sigma rules, 11 log sources”) and which event logs Velociraptor is watching (e.g., Sysmon, PowerShell, Windows Firewall). If a log file doesn’t exist, you’ll see an “unable to open” message—no biggie, it just means that log isn’t active on the endpoint.
Sending Detections to Copilot
Detecting threats is only half the battle. You need those alerts in your incident management tool to track and respond. We’ll use Copilot, an open-source platform for alert and case management, to handle Sigma detections.
Step 1: Update Copilot
Make sure Copilot is running the latest build (check their GitHub for releases). You’ll also need to update Copilot’s .env file with a Velociraptor API header. This header authenticates requests between Velociraptor and Copilot. You can use the default header or create a custom one—copy it from Velociraptor’s docs and paste it into .env.
Restart Copilot to apply the changes.
Step 2: Create a Copilot Artifact in Velociraptor
Velociraptor needs an artifact to forward Sigma detections to Copilot. Here’s how to set it up:
- Add a New Artifact: In Velociraptor, go to View Artifacts > Add an Artifact. Paste the YAML definition for the Copilot integration artifact (available in Velociraptor’s Sigma docs). This YAML configures a POST request to send detections to Copilot.
- Save the Artifact: Click Save. The artifact should now appear in your server’s artifact list.
- Update Server Monitoring: Go to Server Events > Update Server Monitoring Table. Search for Copilot.Events.Upload and select it.
- Configure Parameters:
- Copilot Server: Enter the hostname, domain, or IP of your Copilot instance (e.g., copilot.yourdomain.com or 192.168.1.100).
- API Header: If you customized the Velociraptor API header in Copilot’s .env, update it here.
- Wazuh Index Pattern: Leave this as wazuh unless you’ve changed Wazuh’s index name.
- Client Artifacts to Watch: Select Windows.Hayabusa.Monitoring to forward its detections.
- Launch Monitoring: Click Launch. Velociraptor will start sending Sigma alerts to Copilot.
Step 3: Test the Integration
Let’s trigger some alerts to see the pipeline in action. On your test endpoint, rerun the PowerShell attack simulator. Wait a minute (or whatever your monitoring frequency is), then check Velociraptor’s Server Events > Copilot.Events.Upload. You should see logs confirming that detections were sent.
Now, hop over to Copilot’s Incident Management > Alerts page. You’ll see new alerts tagged with “Velociraptor” and “Sigma.” Each alert includes:
- Rule Title: The Sigma rule that triggered (e.g., “Malicious PowerShell Command”).
- Severity: High or Critical, based on your config.
- Event Details: Info about the triggering event.
- Index Status: If Copilot finds a matching Wazuh event, it links to it. If not, it says “Not Applicable” (e.g., if Wazuh didn’t log the event).
You can drill into alerts, add comments, or build a timeline for investigation. Copilot auto-tags Sigma alerts and adds comments with rule details, making triage a breeze.
Fine-Tuning and Troubleshooting
Velociraptor’s Sigma integration is powerful, but no setup is perfect out of the box. Here are some tips to keep things running smoothly:
- Manage Log Volume: If you’re seeing too many low-severity alerts, tweak the monitoring artifact to filter for High and Critical only. This reduces noise and keeps your SIEM lean.
- Handle Exclusions: Regularly review alerts to identify false positives. Add regex exclusions as needed to skip noisy rules.
- Monitor CPU Usage: Frequent scans (e.g., every 5 seconds) can tax endpoints. If you notice slowdowns, bump the frequency to 120 seconds or more.
- Check Logs: Velociraptor’s monitoring logs are your friend. If alerts aren’t flowing, verify that the agent is watching the right log sources (e.g., Sysmon).
- Update Rules: Sigma rules evolve fast. Periodically rerun Server.Import.CuratedSigma to grab the latest from Hayabusa and Sigma HQ.
If Copilot isn’t getting alerts, double-check:
- The API header in both Velociraptor and Copilot’s .env.
- The Copilot server address in the Copilot.Events.Upload artifact.
- That Windows.Hayabusa.Monitoring is active in Velociraptor’s client events.
Exploring Advanced Features
Feeling adventurous? Velociraptor’s latest releases hint at a notebook feature for crafting custom Sigma rules. It’s not fully documented yet, but it lets you write rules tailored to your environment. Keep an eye on Velociraptor’s GitHub for updates, or experiment with the notebook in a test setup. If you try it, share your findings with the community—it’s a great way to contribute.
Why This Matters
By combining Velociraptor’s Sigma integration with Copilot, you’re building a lean, mean threat detection machine—all on open-source tools. This setup gives you:
- Efficient Detection: Sigma rules run on endpoints, minimizing log bloat.
- Automated Monitoring: Scans happen in the background, freeing you for other tasks.
- Seamless Alerting: Detections flow into Copilot for easy triage and response.
- Flexibility: Customize rules, exclusions, and frequencies to fit your environment.
Whether you’re securing a small lab or a sprawling enterprise, this pipeline delivers enterprise-grade detection without the enterprise price tag. Plus, it’s just cool to see those Sigma alerts pop up in Copilot, knowing you built it yourself.
Wrapping Up
There you have it—a step-by-step guide to supercharging your SIEM with Velociraptor’s Sigma rule detection and Copilot’s incident management. We covered setting up Sigma rules, automating scans, forwarding alerts, and tweaking the setup for your needs. It’s a lot to digest, but once it’s running, you’ll have a robust, open-source threat detection system that rivals commercial solutions.
Got questions or cool tweaks? Drop them in the comments on Velociraptor’s or Copilot’s community forums. The open-source security crowd loves to share. Until next time, keep your endpoints locked down and your alerts flowing.


0 comments:
Post a Comment